

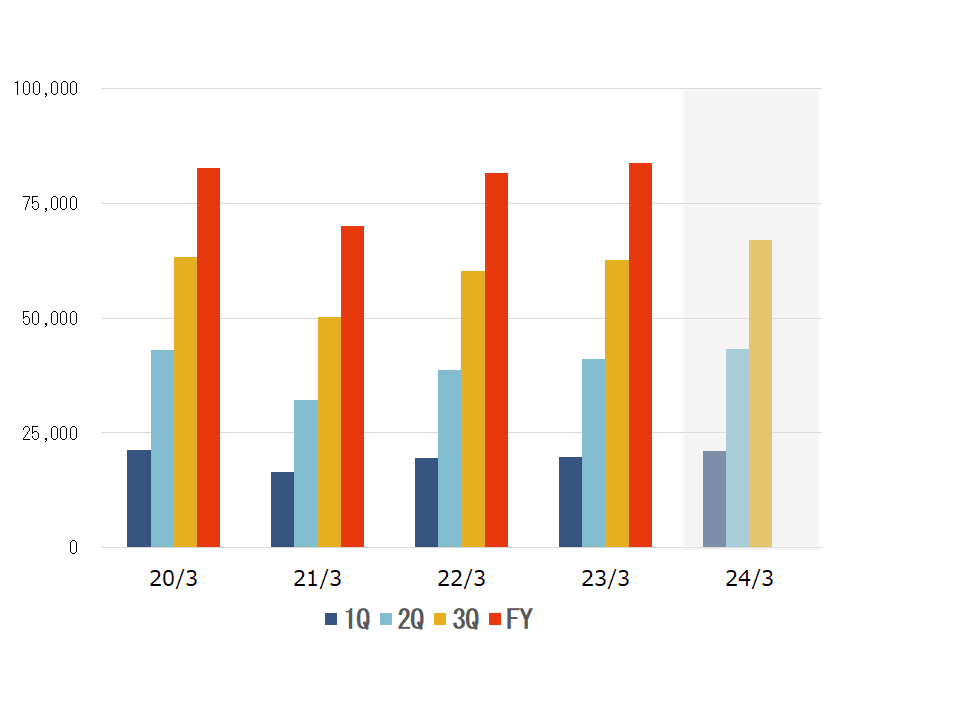
Net Sales
(millions of yen)
| 20/3 | 21/3 | 22/3 | 23/3 | 24/3 | |
|---|---|---|---|---|---|
| FY | 82,619 | 69,967 | 81,486 | 83,840 | |
| 3Q | 63,383 | 50,304 | 60,189 | 62,555 | 66,970 |
| 2Q | 42,981 | 32,100 | 38,677 | 40,988 | 43,216 |
| 1Q | 21,311 | 16,441 | 19,481 | 19,753 | 21,127 |
Sales by Product
(millions of yen)
| 20/3 | 21/3 | 22/3 | 23/3 | 24/3 | |
|---|---|---|---|---|---|
| Car electronics | 67,419 | 56,755 | 66,524 | 68,271 | |
| Mobile communications | 901 | 1,027 | 937 | 986 | |
| AV equipment | 887 | 506 | 419 | 277 | |
| Digital still camera | 1,333 | 698 | 625 | 591 | |
| Amusement | 266 | 176 | 139 | 165 | |
| Others | 11,809 | 10,799 | 12,837 | 13,547 | |
| Total | 82,619 | 69,967 | 81,486 | 83,840 |
Sales by type of PCBs
(millions of yen)
| 20/3 | 21/3 | 22/3 | 23/3 | 24/3 | |
|---|---|---|---|---|---|
| Double-sided PCBs | 13,094 | 9,759 | 10,606 | 10,091 | |
| Multilayered PCBs | 42,401 | 36,391 | 44,096 | 47,656 | |
| HDI PCBs | 21,375 | 18,463 | 21,084 | 20,503 | |
| Others | 5,747 | 5,352 | 5,699 | 5,588 | |
| Total | 82,619 | 69,967 | 81,486 | 83,840 |
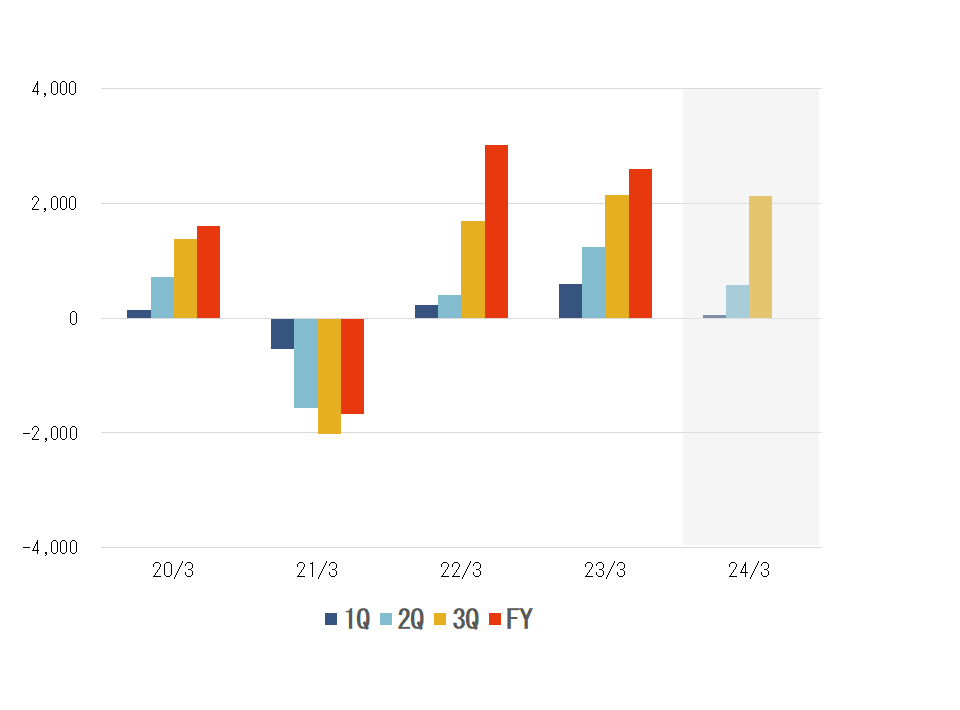
Operating Income
(millions of yen)
| 20/3 | 21/3 | 22/3 | 23/3 | 24/3 | |
|---|---|---|---|---|---|
| FY | 1,601 | △1,676 | 3,021 | 2,605 | |
| 3Q | 1,375 | △2,017 | 1,685 | 2,136 | 2,123 |
| 2Q | 715 | △1,560 | 399 | 1,245 | 571 |
| 1Q | 144 | △546 | 221 | 599 | 56 |
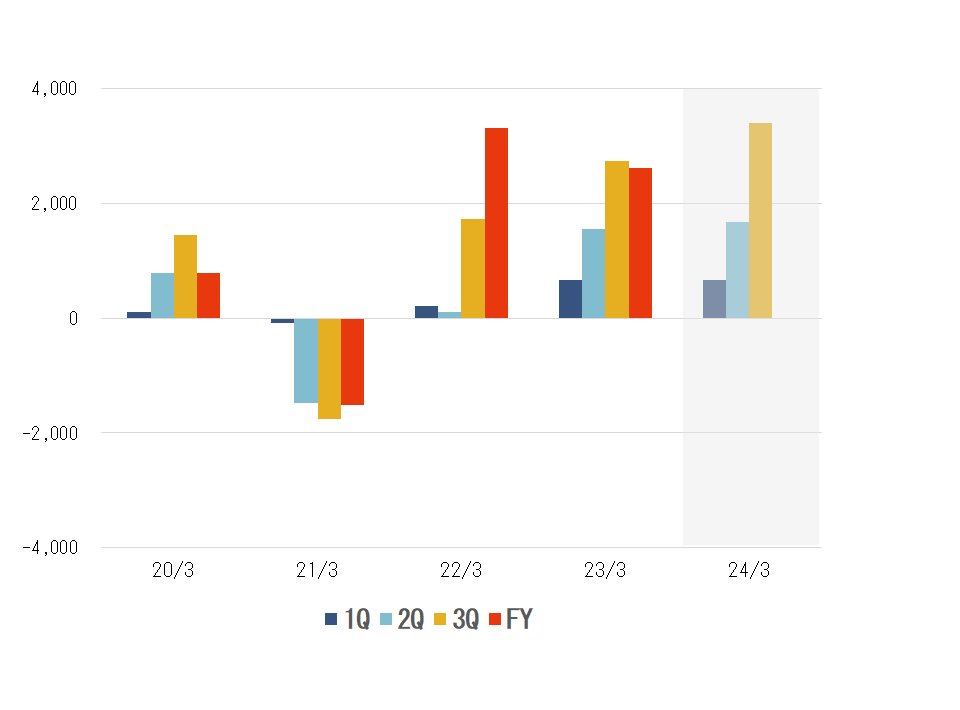
Ordinary Income
(millions of yen)
| 20/3 | 21/3 | 22/3 | 23/3 | 24/3 | |
|---|---|---|---|---|---|
| FY | 792 | △1511 | 3,305 | 2,622 | |
| 3Q | 1,443 | △1,761 | 1,722 | 2,738 | 3,402 |
| 2Q | 779 | △1,485 | 107 | 1,552 | 1,677 |
| 1Q | 103 | △82 | 206 | 663 | 661 |
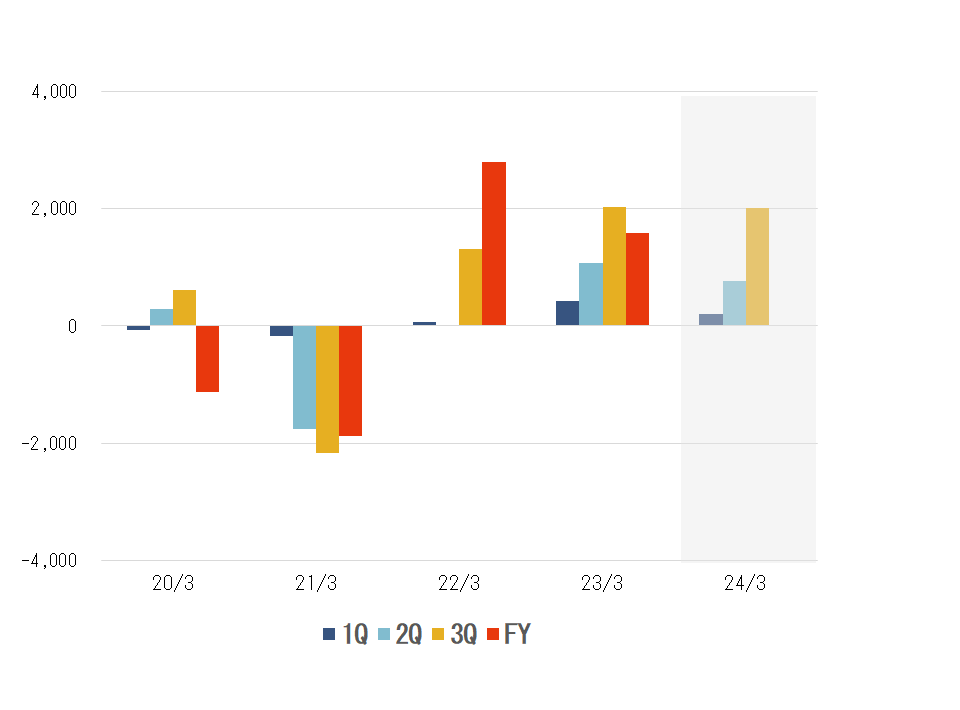
Profit attributable to owners of parent
(millions of yen)
| 20/3 | 21/3 | 22/3 | 23/3 | 24/3 | |
|---|---|---|---|---|---|
| FY | △1,128 | △1,868 | 2,785 | 1,588 | |
| 3Q | 610 | △2,162 | 1,311 | 2,018 | 2,006 |
| 2Q | 287 | △1,748 | 13 | 1,068 | 759 |
| 1Q | △74 | △169 | 65 | 432 | 206 |
Earnings per Share
(yen)
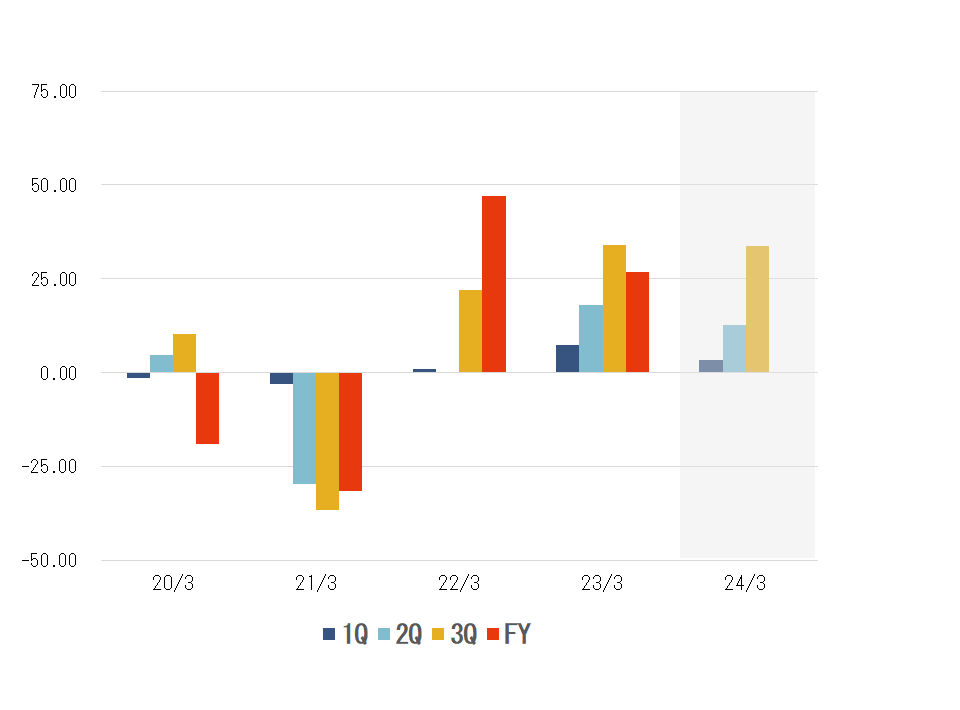
| 20/3 | 21/3 | 22/3 | 23/3 | 24/3 | |
|---|---|---|---|---|---|
| FY | △19.06 | △31.57 | 47.05 | 26.83 | |
| 3Q | 10.32 | △36.52 | 22.16 | 34.10 | 33.89 |
| 2Q | 4.85 | △29.53 | 0.22 | 18.05 | 12.83 |
| 1Q | △1.26 | △2.86 | 1.11 | 7.30 | 3.49 |
Operating Profit Margin
(%)
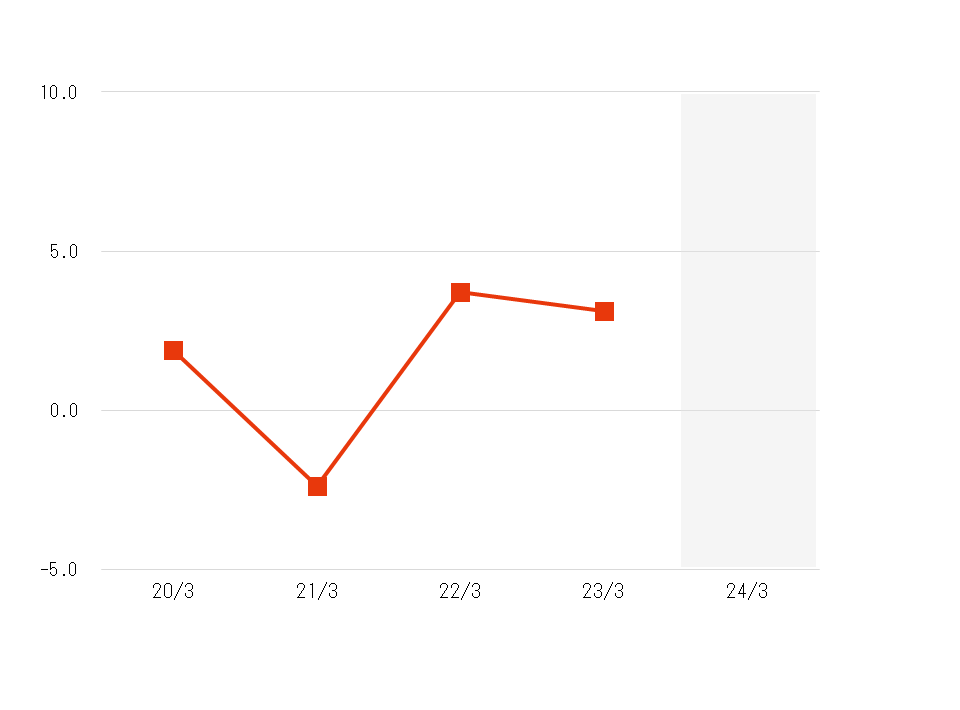
| 20/3 | 21/3 | 22/3 | 23/3 | 24/3 | |
|---|---|---|---|---|---|
| FY | 1.9 | △2.4 | 3.7 | 3.1 | |
| 3Q | - | - | - | - | - |
| 2Q | - | - | - | - | - |
| 1Q | - | - | - | - | - |
*The above data is updated each full year.
Return On Equity (ROE)
(%)
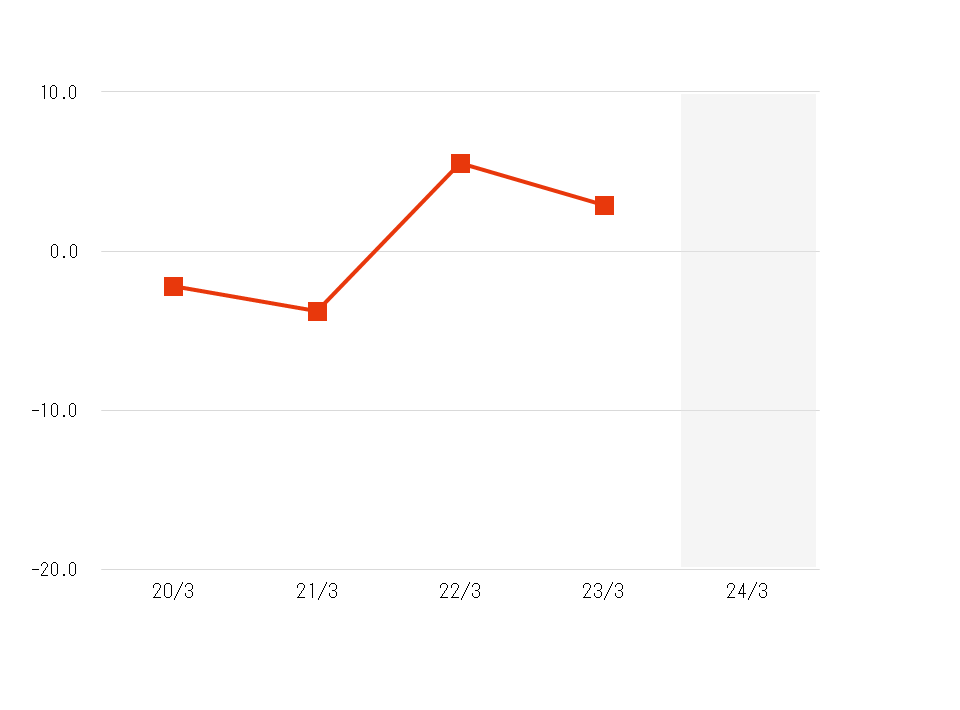
| 20/3 | 21/3 | 22/3 | 23/3 | 24/3 | |
|---|---|---|---|---|---|
| FY | △2.2 | △3.8 | 5.5 | 2.9 | |
| 3Q | - | - | - | - | - |
| 2Q | - | - | - | - | - |
| 1Q | - | - | - | - | - |
*The above data is updated each full year.
Net Assets
(millions of yen)
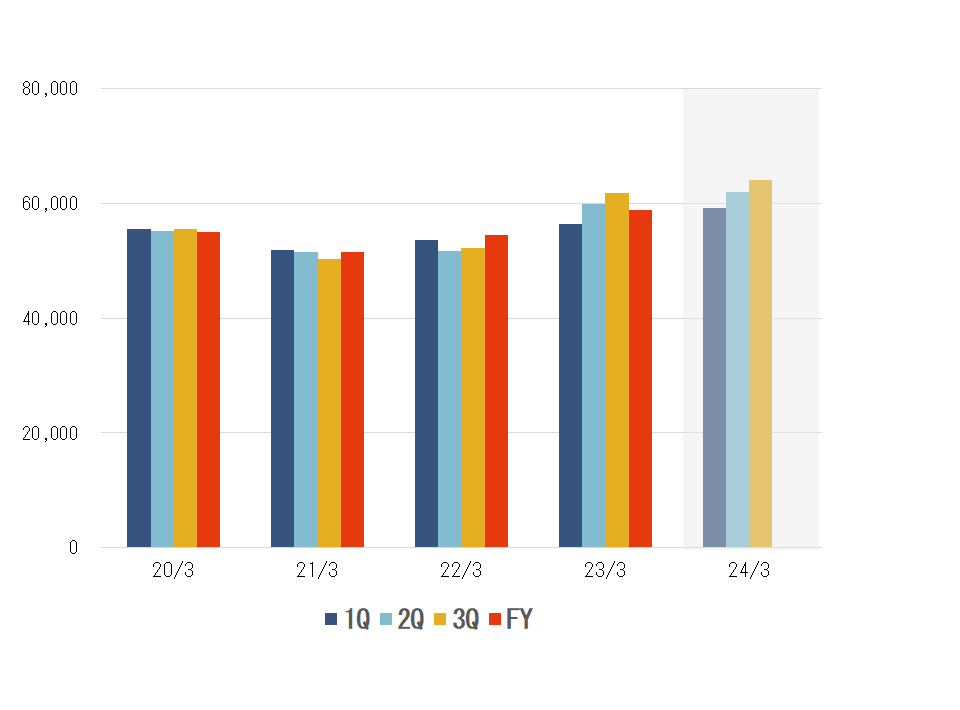
| 20/3 | 21/3 | 22/3 | 23/3 | 24/3 | |
|---|---|---|---|---|---|
| FY | 54,932 | 51,519 | 54,466 | 58,779 | |
| 3Q | 55,472 | 50,321 | 52,239 | 61,723 | 64,026 |
| 2Q | 55,164 | 51,442 | 51,706 | 59,842 | 61,969 |
| 1Q | 55,575 | 51,914 | 53,565 | 56,375 | 59,184 |
Equity Ratio
(%)
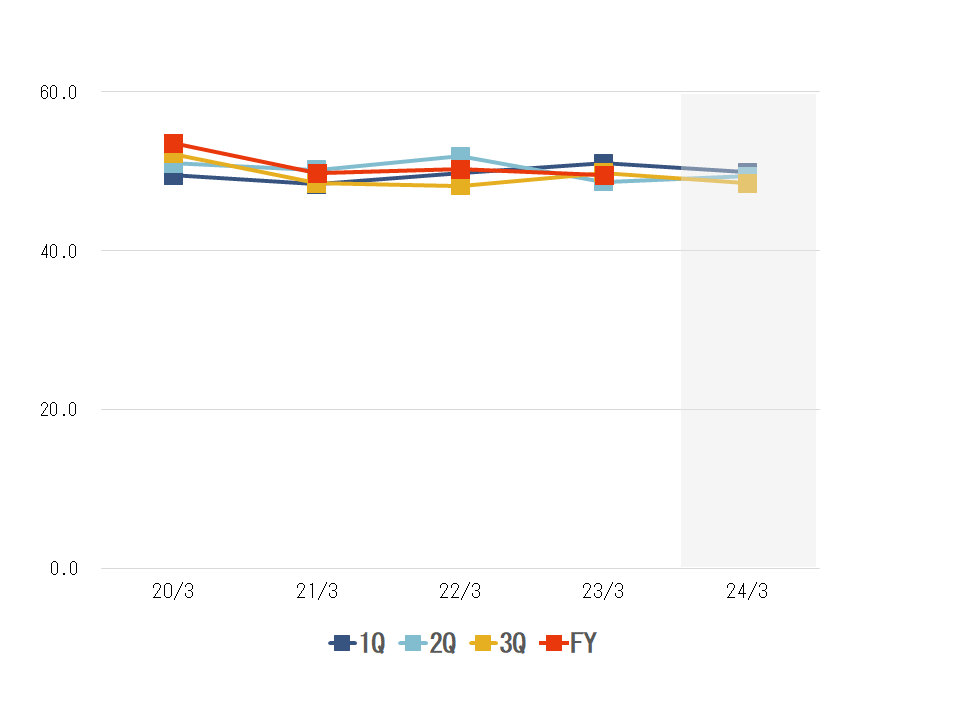
| 20/3 | 21/3 | 22/3 | 23/3 | 24/3 | |
|---|---|---|---|---|---|
| FY | 53.6 | 49.8 | 50.3 | 49.6 | |
| 3Q | 52.2 | 48.5 | 48.2 | 49.8 | 48.5 |
| 2Q | 51.0 | 50.2 | 51.9 | 48.7 | 49.4 |
| 1Q | 49.5 | 48.4 | 49.8 | 51.0 | 49.9 |
Dividends per Share
(yen)
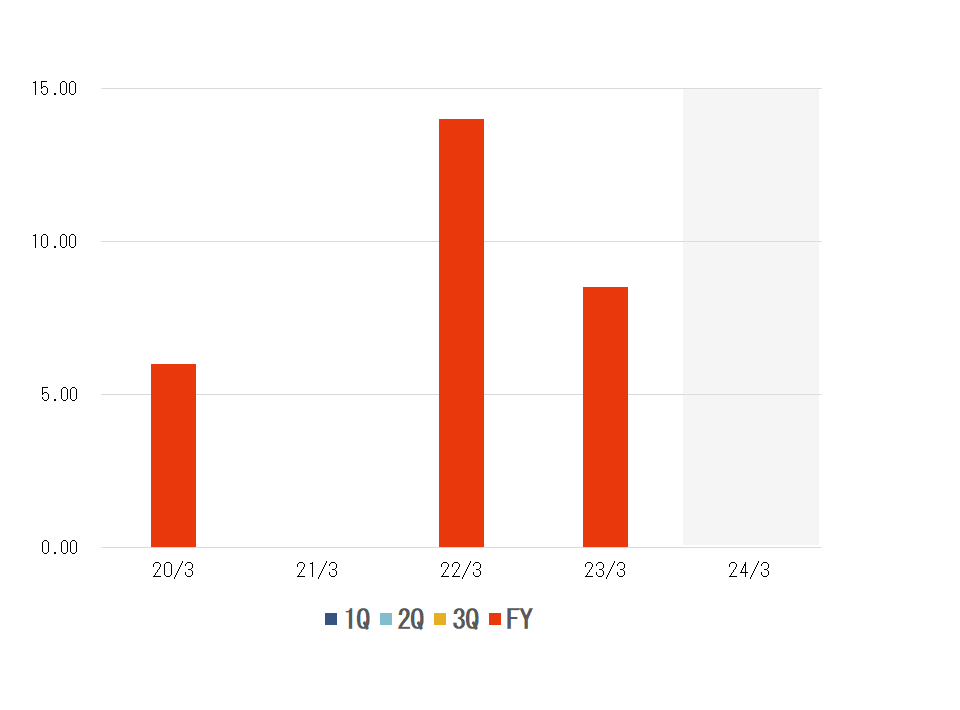
| 20/3 | 21/3 | 22/3 | 23/3 | 24/3 | |
|---|---|---|---|---|---|
| Annual total | 6.00 | 0.00 | 14.00 | 8.50 | |
| FY | 6.00 | 0.00 | 14.00 | 8.50 | |
| 2Q | 0.00 | 0.00 | 0.00 | 0.00 | 0.00 |
- * 2nd Quarter represents an aggregate of the 1st to 2nd quarters.
- * 3rd Quarter represents an aggregate of the 1st to 3rd quarters.
Note
- ・In the event of announcements of corrections or revisions to financial results, the data on this site will not be immediately rectified to reflect such changes.
- ・Frequency of updates may vary due to changes in earnings report format.
The data used within this site is compiled from the corporate prospectus and earnings announcements.
In the preparation of the various data shown within this site, we make every effort to ensure its accuracy. But despite our best efforts, the possibility for inaccuracy in the data due to reasons beyond our control exists.
For more detailed earnings information please click on the "IR Library" link button.